Analysing Sprint Performance with Danu - using Drive Index
Breaking down key Danu metrics in acceleration and maximum velocity
Sprint performance isn’t just about how fast an athlete runs, it’s about how they generate speed. Two athletes may record the same 40m time, yet arrive there using completely different strategies, mechanics and levels of efficiency.
With Danu, sprint analysis moves beyond simple timing and into how speed is generated, controlled and sustained without sacrificing your athlete's natural training ground for a lab. Danu analyses the entire sprint from the acceleration phase through the maximum velocity phase, and evaluates relevant metrics in each. Practitioners can use Danu to uncover what strategies their athletes use to achieve a velocity from each step to an entire sprint performance, identify protective inefficiencies, and targeted opportunities for development.
Within that 40m, athletes may adopt very different strategies at different stages:
- Do they rely on back-side mechanics, pushing forcefully into the ground?
- Or do they emphasise front-side mechanics, rapidly pulling the leg through?
- How efficiently are the limbs separated and what are your athletes’ range of motion?
How Danu Metrics can help you profile your athletes strategy:
Metric | Back Side Mechanical Runner | Front Side Mechanical Runner |
Contact Time | Longer | Shorter |
Drive Index | Higher | Lower |
CoP Progression | Slower | Faster |
Peak Tibial Acceleration | Lower | Higher |
Stride Frequency | Lower | Higher |
Stride Length | Longer | Moderate |
It is important to note that neither profile is right or wrong.
- Team-sport athletes may benefit from a hybrid approach depending on positional demands. Multi directional movements and deceleration also are key movement strategies within team sports.
- Track sprinters often evolve from back-side dominant acceleration to front-side dominant max velocity.
- Rehabilitation and return-to-play contexts may temporarily shift athletes toward back-side mechanics.
- Court based sports have a heavier focus on lateral movements than horizontal running.
Rethinking Acceleration: Beyond the 10m Time
Acceleration is often reduced to a single outcome measure: Time. While useful, this tells us what happened, not how it happened. For example: Two athletes can achieve the same 10m time - one by pushing longer (back side), the other by cycling their legs faster (front side).
The optimal acceleration strategy depends on the sport. Some athletes need to get from A to B as fast as possible and transition smoothly into max velocity. Others, particularly in field and court sports need to accelerate rapidly with increased control, keeping their centre of mass adaptable so they can react to a ball, an opponent or a tackle. This is where deceleration technique becomes important.
The value of systems like Danu is the ability to quantify features of these strategies, track how they change over time, and align mechanics with the athlete’s sport, role, and health.
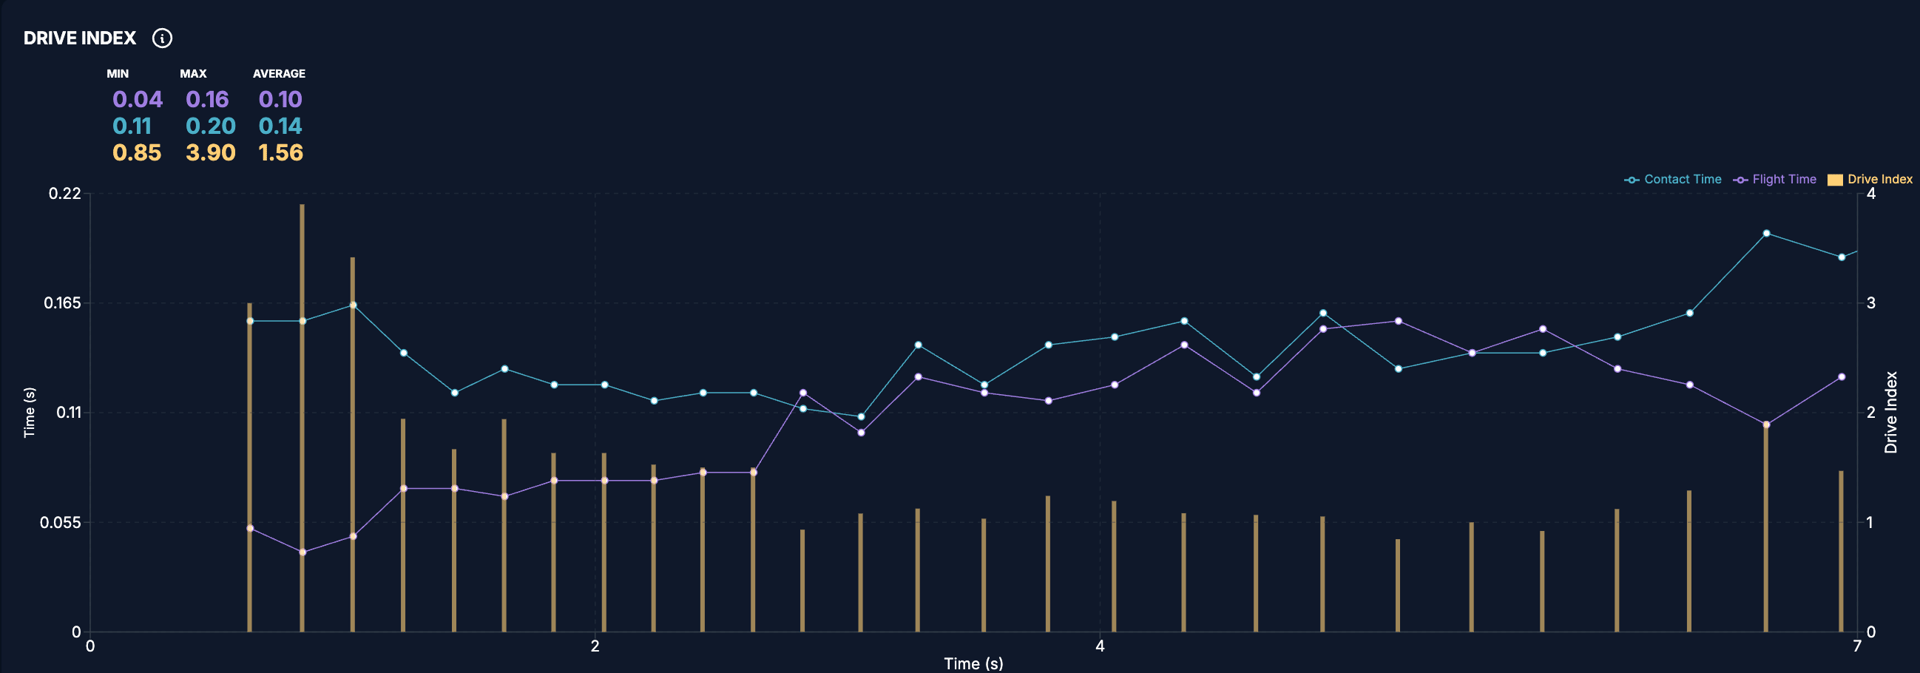
Fig 1.) Danu Drive Index. Elite Sprinter 15m Acceleration
The Acceleration Phase: Producing Horizontal Force
During the first 3-4 steps within the 10m acceleration, the primary objective is to generate horizontal propulsion. In this phase, effective accelerators typically demonstrate longer contact times & shorter flight times, reflecting the athlete spending more time applying force into the ground rather than moving through the air.
Drive Index in the Acceleration Phase
While there are many metrics that could apply to assessing an athlete's acceleration technique, one of the most insightful acceleration metrics is Drive Index (DI) - a ratio of contact time to flight time. It is a metric used in sprint analysis to quantify the "push" (ground contact) versus "swing" (leg recovery) phases. It assesses how much drive an athlete applies into the ground and how quickly they get their leg back ready for the next step, influencing efficiency and speed.
(Fig 1. demonstrates how Danu demonstrates DI for a 15m sprinter's acceleration)
- Higher Drive Index = more time on the ground relative to time in the air. Indicates effective force application and forward projection.
Elite accelerators typically show high DI values in early steps, often averaging around 2.0 across the first 4-5 steps, before gradually decreasing as they transition towards upright running.
In combination with other Danu metrics, DI helps tell the story of acceleration, not just how fast the athlete moves, but how they generate that speed. Combining DI with foot strike mechanics provides insight into how the foot interacts with the ground. During early acceleration, you would typically expect a more forefoot-dominant CoP pattern, as prominent heel striking can increase breaking forces. Similarly, in early acceleration you might expect shorter step lengths with progressive increases with each step.
Further Down the Track: Transitioning to Maximum Velocity
Stiffness and Elastic Efficiency:
As the athlete progresses into the maximum velocity phase, the demands change. The focus shifts from producing force to absorbing and reapplying it efficiently. Stiffness becomes vital as your athlete wants to be able to maintain max speed for as long as possible - something about Usain Bolt in fact that was quite exceptional. While he was not the fastest accelerator, his superpower was in his ability to hold his max velocity for longer than any other athlete on the track.
Drive Index through Max Velocity:
While Drive Index is highest during early acceleration, how it changes through the transition phase is equally informative. A sudden drop in DI may indicate a premature upright posture, or loss of horizontal force effectiveness. A smooth decline suggests a well-managed transition into max velocity mechanics.
Within this phase, the average DI of elite sprinters in the 2017 100m World Championships Final ranged from 0.7-0.9 across both the men and women's race. (McNally)
The emphasis in this phase of a sprint, often from around 30m through to when an athlete starts to fatigue within their sprint is on how efficiently can your athlete maintain maximal speed with as little breaking forces as possible.
Key Danu metric indicators you might look for here include:
- Shorter contact times - Reflection of higher levels of neuromuscular coordination and elastic efficiency.
- Stabilised and consistent step length - Left - Right symmetry is important as irregular asymmetries may inform deficiencies or mobility issues from the hip.
- CoP Initial Foot striking mid to forefoot.
The Whole Picture
Sprint performance is multi-dimensional. Time alone cannot explain how an athlete accelerates, transitions, or sustains speed. By breaking sprinting into phases and analysing metrics such as Drive Index, contact and flight time, step length, CoP mapping, peak tibial accelerations and symmetry, Danu enables a deeper understanding of sprint mechanics; tailored to both the sport and the individual athlete.
From an injury management perspective, understanding how these metrics speak to one another throughout any sprint can be a powerful tool in protecting your athletes from injuries. Irregular asymmetries, provided for every metric in Danu might suggest strength or mobility deficits, as well as protective strategies following an injury - an athlete with a shorter step length may be dragging the injured limb, leading to further issues.
The result is smarter training decisions, clearer performance insights, and more confident progression from development to elite performance.
References
[1] | McNally, Owen. “A Bias toward Speed? Breaking down the Sprinting Cycle - SimpliFaster.” SimpliFaster, 27 Feb. 2021, simplifaster.com/articles/breaking-down-sprint-cycle-video/. Accessed 29 Dec. 2025. |